The NFL recently crowned another champion following their 47th Super Bowl and unfortunately my beloved Minnesota Vikings were not that team, yet again. It is getting harder to convince my 7-year-old son that they are the greatest team in NFL history. I might have to let him down gently that it is going to be tough cheering for the lovable losers of the NFL for the rest of his life and he might want to jump ship to another team now.

Despite that, we got our victory celebration earlier in the year when I took my son to his first Vikings game against the Indianapolis Colts. We were down 33-0 at halftime and my son wanted to leave. I kindly told him that after driving six hours through a snow storm the night before to get to the game we weren’t going anywhere. Luckily, we got to witness the largest comeback in NFL history and the Vikings winning the game in dramatic fashion!
Even though we celebrated that game like we won the Super Bowl, it was very predictable that the Vikings would lose before making it that far. However, it was a bit of a surprise that the Kansas City Chiefs beat the Philadelphia Eagles. Even though I was rooting for the Chiefs and their likeable star Patrick Mahomes, I may have lost a little money betting that the Eagles would win.
Most NFL “experts” believed that the Eagles’ tough defense and pass rush would be too much for the Chiefs to handle, especially because Mahomes was supposed to be hobbled by an injured ankle. But the somewhat unexpected happened with the Chiefs’ offensive line holding off the pass rush and Mahomes by some miracle sprinting around the field like Carl Lewis despite being injured. In the end, it was the Chiefs’ outstanding offense and “Mahomes Magic” that prevailed over the Eagles’ softer-than-expected defense.
Like the Super Bowl and other sports, the financial markets can be just as unpredictable. For example, heading into 2022 most market “experts” believe it was going to be a pretty good year and, of course, they turned out to be wrong. Look at the below predictions from some of the largest investment companies on how the markets would perform in 2022 (and try not to laugh):
Blackstone: The Ten Surprises of 2022
- FORECAST: “Gold reclaims its title as a haven for newly minted billionaires, even as cryptocurrencies continue to gain market share.”
- REALITY: Gold began the year at a value of $1,814. In early March, gold reached a year-high of $2,049 following Russia’s invasion of Ukraine but reached a low of $1,627 in October and ended the year at a value of $1,824. From the beginning of the year, gold experienced a gain of only 0.5%.1 Cryptocurrencies faced a difficult year with the market losing nearly $2 trillion in market value compared to its high in November 2021. The declines were attributed to the fall of major crypto players, the scandal regarding FTX (a large crypto exchange), and the realization that additional regulations might be needed to regulate this space.2
DoubleLine Capital: Gundlach's Forecast for 2022
- FORECAST: “When the U.S. dollar starts to decline, you’re going to see a tremendous outperformance by non-U.S. stocks. Emerging markets will be a very strong performer when that happens.”
- REALITY: Contrary to the forecast, as the year ended, the U.S. dollar was set to post an annual gain of 7.9% against a basket of other currencies.3 The conflict in Ukraine, high oil prices, rising inflation and a stronger U.S. dollar all weighed on emerging markets performance in 2022. As of November 2022, the MSCI Emerging Markets Index was down about 40% since its peak in February 20214. However, in a broader context, recent performance in Q4 proved promising as the MSCI Emerging Markets Index and MSCI World ex USA Index outperformed the Russell 3000 Index by nearly 2.5% and 9% respectively5, highlighting the potential benefits of staying globally diversified.
J.P. Morgan: 2022 Market Outlook: More Upside for Stocks, Economic Growth To Rebound
- FORECAST: “We expect S&P 500 to reach 5050 on continued robust earnings growth as labor market recovery continues, consumers remain flush with cash, supply chain issues ease, and inventory cycle accelerates off historic lows.”
- REALITY: The S&P 500 Index closed the year at 3,840 points6, roughly 24% lower than predicted.
Morgan Stanley: Stock Market Outlook 2022
- FORECAST: “Opportunity in Growth/Technology Stocks. We are less negative on growth than we have been, given the magnitude of recent underperformance vs. the broad market. Recent underperformance despite numerous impressive earnings reports means many of these large-cap growth names are now trading at very reasonable valuations.”
- REALITY: Growth stocks were crushed by rising interest rates in 2022, experiencing their worst calendar year in more than a decade, while value stocks showed a comeback. As of December 31, 2022, the Russell 3000 Value Index outperformed the Russell 3000 Growth Index by 21%. Value also dominated globally as of the end of 2022, with the MSCI All Country World IMI Value Index outperforming its growth counterpart by 20%7.
Wells Fargo: Wells Fargo 2022 Outlook
- FORECAST: “We expect average consumer price inflation of 4.0% in 2022, down from 6.2% in October 2021. Inflation should remain above its long-term average but should slowly ease if supply shortages normalize as we expect.”
- REALITY: Inflation, as measured by the consumer price index, increased in 2022. The Federal Open Market Committee (FOMC) decided to start increasing rates in March to combat rising inflation eating into the purchasing power of everyday Americans and bring inflation down to its long-term 2% target. These efforts did pay off to some degree toward the end of 2022 as inflation levels rose at an annual rate of 7.1% in November as compared with 7.7% in October, and the expected rate of 7.3%.8
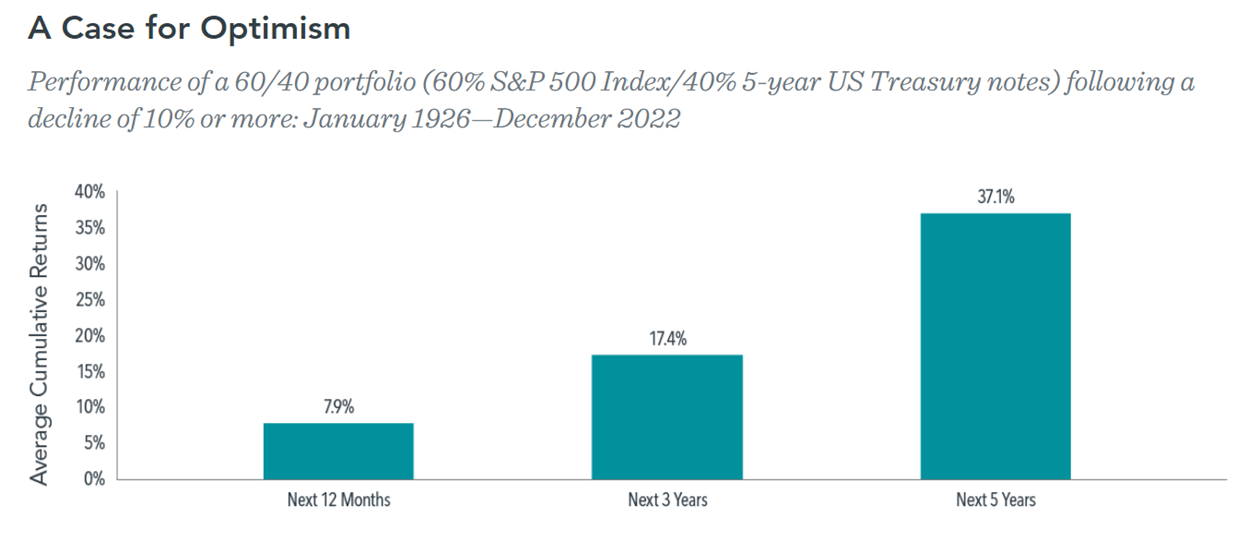
Looking at the performance of a 60% stock and 40% bond portfolio following a decline of 10% or more since 1926, we clearly see that returns on average have been strong in the subsequent one- , three-, and five-year periods.
 Daily market news and commentary can challenge investment discipline. Some messages stir anxiety about the future, while others tempt people to chase the latest investment fad. When headlines unsettle you, remember your investment plan and maintain a long-term perspective. We believe in betting on the long-term success of the financial markets. Just remember to not bet on the long-term success of the Minnesota Vikings.