Have you ever thought you would like to be a farmer or operate a farm? Maybe you said no to that idea, but are curious if you should invest in a farm.
Farming is certainly one of the oldest professions in the history of mankind. And like most major industries, it has gone through major evolutions, innovations, and changes.
The days of grandpa’s farm have given way to the same technological advances that have shaped the modern industrial system.
Yes, farming is a complex business that runs on the demand for food, fiber, and fuel. Gone are the days of subsistence farming, where families lived on the land, raised their families, and in good years, had excess produce and livestock to sell.
Today’s system is far different. It is also very diversified. For this conversation, let’s take a look at the average farm in Iowa and look at the size, scope, and profitability available to a farmer operator.
An Average Farm in Iowa
According to the Iowa Agriculture Literacy Foundation:
- Iowa has a total of 36 million acres.
- About 85% (30,563,878 acres) of that land is used for farmland.
- Most farmland in Iowa (26.5 million acres) is used to grow row crops (mostly corn and soybeans).
- Iowa farmers also grow lots of forages (1 million acres), corn for silage (278,370 acres), and oats for grain (36,580 acres).
Of these 30,563,878 acres of farmland, the state of Iowa has approximately 86,104 farms, owned by 143,447 farmers. The average farm size in Iowa is 355 acres. The number of farms is down about 3% since 2012, and the average farm size is up about 3% since 2012.
Similar statistics can be found on the Iowa State University Extension website as well as the United States Department of Agriculture (USDA).
While the statistics are likely accurate, the rest of the story reveals a different reality.
I am writing from the perspective as an independent contractor for AgSurion Risk Consulting, a division of CHS Hedging. AgSurion was formerly Russell Consulting Group, a company started in 1998 by Moe Russell and Terry Jones. Terry and Moe’s company was unique in that its original intent was to help farmers change from laborers to business people and to bring professional financial management to farmers. The comany deals exclusively with farmers and ranchers and advises them on financial analyses of their farms in addition to marketing advice.
The Average Farm
According to the Iowa State University Iowa Community Indicators Program, a farm is defined as any place from which $1,000 or more of agricultural products were produced and sold, or normally would have been sold, during the census year.
From a data standpoint, here are two obvious conclusions:
- A considerable number of very small farms likely bring the average size down.
- Many farms are leased and not owned by the farm operator.
At AgSurion Risk Consulting, our client base has an average farm size of just under 2,000 acres. Not all of the land is owned by our clients. Many rent ground from landlords and absentee owners. We will talk about barriers to entry later.
For now, let’s focus on the profitability of an “average farm” that we work with. Once a year we meet with our farmer clients usually during the winter months. This is normally after they have met with their banker and have a projected income and expense cash flow ready for the coming year.
We take the market value balance sheet provided by their bank, along with the projected cash flow, and run it through our software analysis. Below is an example.
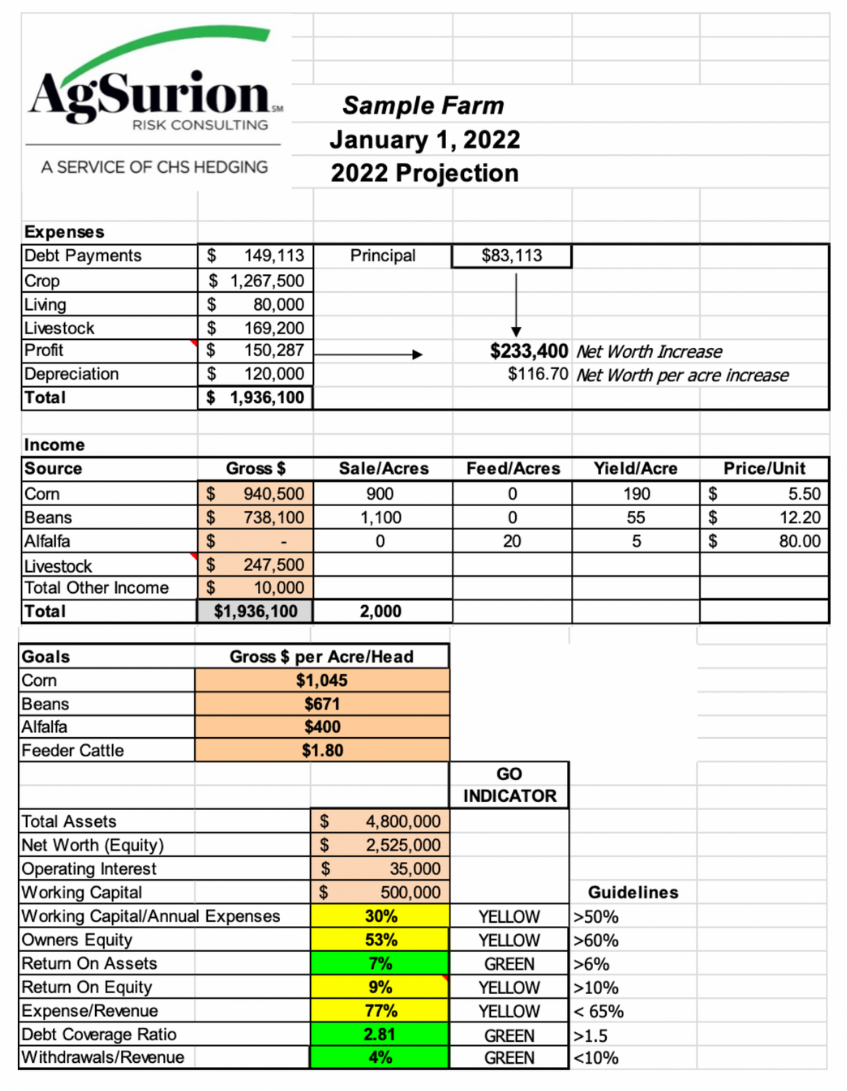
This “Sample Farm” represents a typical farming operation we work with. This sample projection was completed on January 1, 2022 and is the “projected” profitability for this sample client’s farming operation for the year. Overall, the concept of building in a target profit and planning to be profitable helps make a farm a business.
Three major components are included in this spreadsheet:
- Expenses: All the expenses for the year are totaled including debt payments, crop, living, livestock, profit, depreciation. The variable is profit.
- Income: The client tells us the number of acres and expected yield and then we look at the current futures prices and determine a price that is attainable. Livestock income is included as well as any off-farm and other income. In our system, income always equals expense with profit changing anytime another number changes. When we are comfortable that we have a realistic goal, we are able to set targets for sales in gross $ per acre, and in this case, gross $ per pound in livestock.
- Go Indicator: This last section is basically a financial health checkup. Based on standards established by the Financial Standards Task Force, we use key ratio guidelines to analyze the financial risk in the individual operation. The “Farm Financial Standards Task Force” was created in January of 1989 with the mandate to develop and publish standardized Financial Guidelines for Agricultural Producers
In our system, income always equals expense with profit changing anytime another number changes. When we are comfortable that we have a realistic goal, we are able to set targets for sales in gross $ per acre, and in this case, gross $ per pound in livestock.
The financial risk in a farming operation can be measured using a “stop light” type of analysis that will match the customer ratios to one of three categories - green, yellow or red. Green represents less financial risk, yellow more risk, and red for high risk.
Next, we’ll explore owning a farm as an investment as compared to owning a farm as an operating asset.
Owning a Farm as an Investment
How does a farm Return on Assets (ROA) and Return on Equity (ROE) compare to other investments?
Since the largest and most commonly used investment vehicle available is the stock market, I will compare it to that.
What has the Dow Jones Industrial Average averaged over the last 20 years? According to Wealthsimple.com, the annualized average returns of these benchmark indexes for the 20 years ending June 30, 2019 shows the S&P 500 at 5.90% and the Dow at 7.03%.
This compares to AgSurion returns at 7.12% average ROA per year since 2008. (Past results are not a guarantee of future performance.)
Barriers to Entry
Almost anyone can own stocks as the requirements are minimal. Farming, on the other hand, is quite different. Let’s look at what it takes.
The Cost of Iowa Farmland
According to Iowa State University Extension, the 2021 Iowa State University Land Value Survey reported a 29.0% increase to $9,751 per acre on average for Iowa farmland values from November 2020 to November 2021. This dramatic surge is the largest since 2011, and the $9,751/acre nominal land values are the highest ever since the 1940s.
Let’s assume that you were able to buy 160 acres at $9,751 per acre for a total of $1,560,160. This cost alone limits the number of buyers to existing farmers, retired farmers, or investors.
If you are an existing farmer, you would likely use a combination of bank loans, cash, and existing owned farms as collateral. A retired farmer would be a in a similar situation.
An investor may be using a 1031 tax-free land exchange or adding to his existing land holdings. Fortunately, in Iowa, large corporations and foreign entities are prohibited from owning farm ground.
A Typical (cash rental) Return on a Farm Purchased Today by an Investor May Only be 3-4%.
Although we have seen the appreciation of farmland rise dramatically, the average rate of annual increase in the last 41 years has only been 4.44% according to the Iowa State University/Ag Decision Maker-2021 Farmland Value Survey Iowa State University.
It is common for an investor to combine the rate of return from income (3-4%) and the rate of return they would expect from annual appreciation (4.44%). Together the overall rate of return would be in the 7-8.5% range.
Looking back at the Sample Farm, we can assume that the farmer owns some land and cash rents the rest.
The total annual expenses were $1,936,100. This likely means that the operator borrowed money from a bank to finance the operating side of the business. Since this is a projection, we are using what the farmer tells us he has for expected expenses. Some of the expense will occur in advance; others are paid out throughout the year. The variable in all this is Profit.
The total income was $1,936,100. This is the amount of income that must be generated from either yield or price to cover the expenses and provide the target profit.
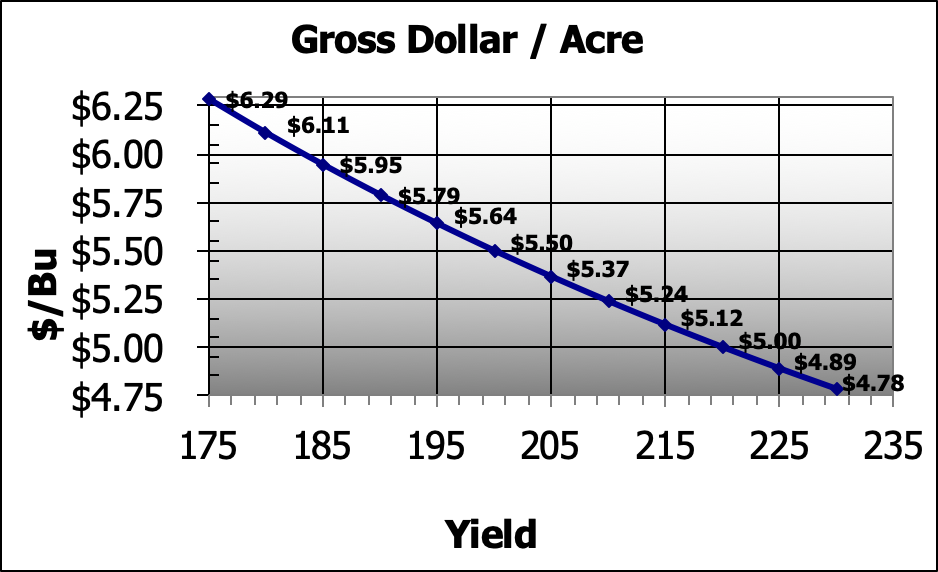
The gross $ per acre and per pound are used to make selling easier. As you can see in the graph below for corn, every blue dot on the sloping line represents the price and yield needed to make the same amount of profit.
The Go Indicator is a benchmark to compare the financial side of the farming business to industry standards:
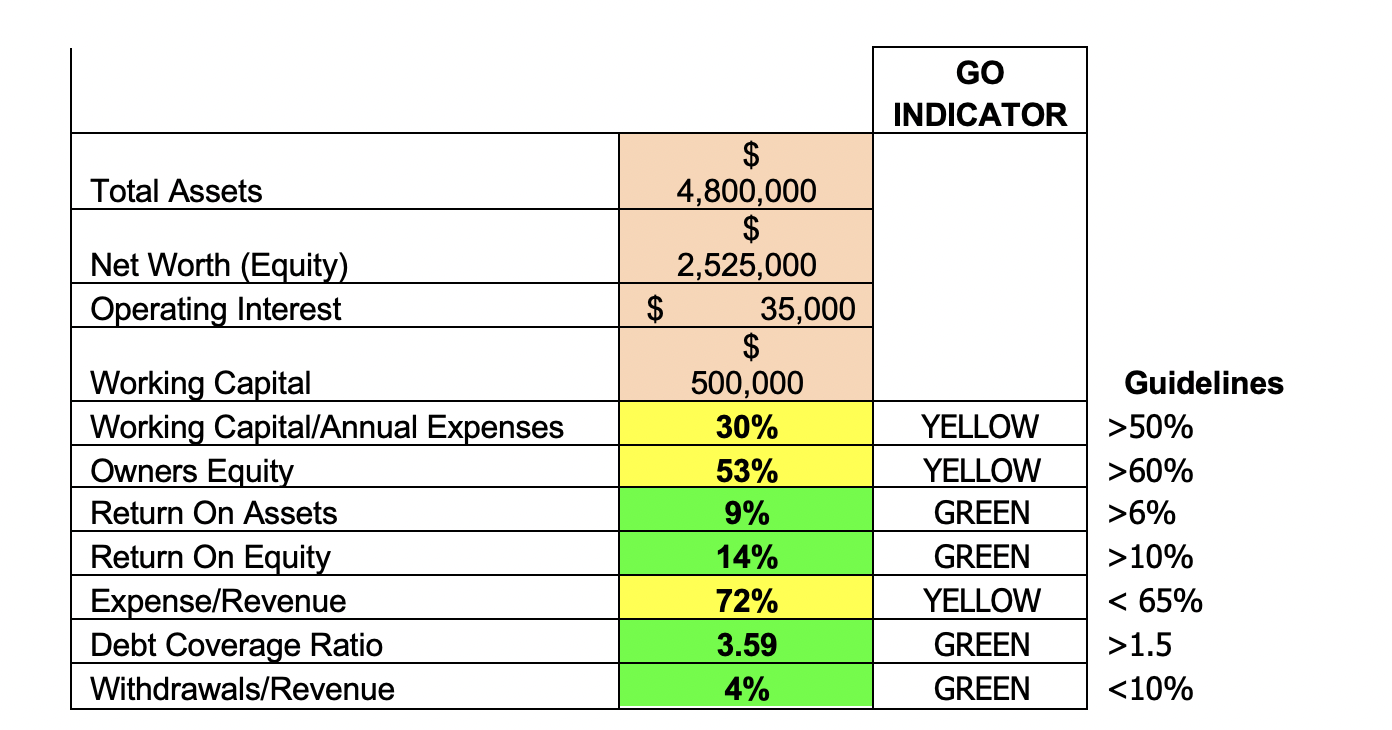
Seven Key Ratios
The seven key ratios at the bottom of the AgSurion Risk Consulting financial analysis were originally derived from the Farm Financial Task Force Standards developed nearly 25 years ago in order to bring consistency to analysis for production agriculture. These have been modified slightly by ARC.
-
Working Capital:
The most notable variance is the working capital standard where ARC’s is significantly tougher to meet green than most standards of lenders. As outlined in the chart, green is having working capital greater than 50% of total expenses including payments and living. This is the most important of the ratios as working capital is the first “shock absorber” to get a grower through financial bumps in the road. -
Overall Equity:
Overall equity should be greater than 60% after putting land in at about 75% of what you think it would sell for to be conservative on your capitalization. -
Return on Assets:
ROA is the net worth increase plus interest paid divided by total assets. -
Return on Equity:
ROI is the total net worth increase divided by total equity. It should always be greater than return on assets. If it is not, the grower is losing money by borrowing money. -
Expenses/Revenue Ratio:
Expenses/Revenue Ratio is an indicator of risk as it determines the margin of income over expenses. 80% or higher is red light, meaning if income fell 10% and expenses rose 10%, all the margin is gone. -
Debt Coverage Ratio:
Deb Coverage Ratio is calculated by adding Profit + Depreciation + Term interest and dividing by the total principal and interest payment for the year. -
Withdrawal to Total Revenue:
Withdrawal to total revenue is the family living or labor to total revenue. It is an indication of the living costs to the size of the operation and generally yellow light is a warning sign that the operation is not large enough to support the lifestyle of the grower.
Summary
Today’s farming operations use modern technology and economies of scale to operate at a level that cover all expenses and return a profit. The capital required to compete continues to increase at a rate that prohibits most people from actively financially participating.
This is not all bad. Farmers supply large quantities of raw products to use for export, further processing, fuel, and feed for livestock.
Today’s investor shouldn’t feel left out as the returns achieved in the various investments in the stock market have a similar rate of return compared to farming over the long run.
Syverson Strege currently works with many farmers to help with their financial planning and investment management needs. If you have questions about investing in a farm or are a farmer who needs financial planning, call Syverson Strege at 515-225-6000.
The material provided is for informational purposes only and should not be construed as a solicitation or a recommendation, to buy or sell any commodity interest. Any charts, graphs, tables, or other information are for illustration purposes only and should not be used as a basis for making any trading decisions.

